
Students pursuing STEM degrees are often looking forward to spending long afternoons in labs, and they will! However, many overlook how much writing is involved in a solid STEM degree program, especially in regard to labs. An extensive lab report can be a daunting task when a student has never conducted an inquiry-based experiment or written a lab report before.
Clapham Upper School students write at least one lab report per semester. These reports inspire them to come to labs prepared, make careful observations, and reflect on the data they collect. They are opportunities to develop the concise, exacting writing style STEM demands. As a student grows throughout their Upper School Experience, they are encouraged to embrace new elements of scientific writing style, fine tune their presentation of graphs and tables, provide replicable methods sections, and engage in rich discussions of their data. Below is a lab report written by a freshman in the Upper School. For this lab, we compared predicted values of acceleration to actual values determined through on-site measurements as students pushed a vehicle across an empty lot:
Car Momentum Lab
This experiment’s goal was to see if the predicted acceleration would align with the actual acceleration or if it would be off. The force being put on the car will also be a factor. According to Newton, acceleration is proportional to the force acting on the mass, so this lab will put that to the test. Having two equations will also be an interesting factor.
The prediction acceleration will be a lot less than the actual. The harder the car is pushed, the more force is being put on the car, which makes the acceleration grow.
Materials:
- Vehicle
- Duct tape
- Stopwatch
- Bathroom weigh scale (2)
A car and a driver were weighed, added together, and converted to Newtons. A section of ten meters was marked to show how far the car needed to be pushed. Then the friction was found by seeing how much force was needed to just barely make the car move. The friction was then subtracted from how much force was being put on the car for each run. The car was then moved by two people holding and pushing on a scale to measure the force. Whoever is moving the car should try to split the force between the two people; so, if 124.6N is desired, each person should be pushing around 62.3N. For the first trial, they pushed at a force of approximately 124.6N over 10m, which took 10.10s the first time, 11.21s the second, and 11.41s the last, the average of which is 10.91s. The second set of runs were being pushed at a force of 258.1N, which took 10.67s, 11.40s, and 9.69s, averaging out to 10.59s. The third group of runs we pushed at 792.1N and were timed at 7.99s, 8.54s, and 8.52s. The mean of these is 8.35s. The last run has a force of 1014.6N with times of 8.54s, 7.54s, and 7.48s.
| Test 1 | Test 2 | Test 3 | Test 4 | |
| Applied force (N) | 124.6 | 258.1 | 792.1 | 1014.6 |
| Average time (s) | 10.91 | 10.61 | 8.33 | 7.85 |
| Test 1 | Test 2 | Test 3 | Test 4 | |
| Predicted acceleration (m/s^2) | 0.09 | 0.19 | 0.59 | 0.76 |
| Actual acceleration (m/s^2) | 0.17 | 0.18 | 0.29 | 0.32 |
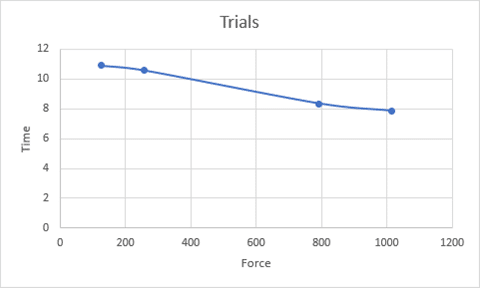
In this graph, the points symbolize each trial, the first one being one and the last one trial four.
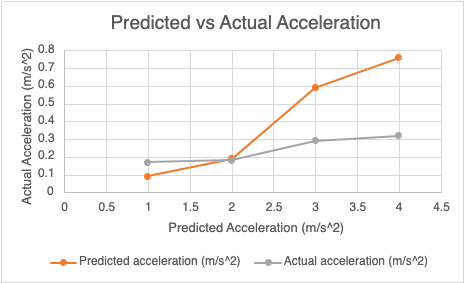
These graphs prove that the more force is being put on the car, the acceleration grows. In the first graph, this is shown by the time decreasing as the force increases. Acceleration is proportional to force being put on a mass according to Newton’s 2nd law. The mass in this case is constant, so this shows that as the force grows, the acceleration grows with it. In the second graph, it shows how the predicted acceleration is different and a lot more than the actual acceleration. One reason that this experiment could go wrong is that it is extremely hard to keep a constant force on the car. It is almost impossible to make it stay at the exact force, and near just as hard to keep it close to it. A good follow-up experiment is to try to do the same force as the original trials, which would help see if the force – of the original trial – being put on the car was close to the desired amount. Another lurking variable could be that the road was not even. Though the tests would still be proportional to each other because they were taken at the same place, the acceleration may not be accurate.
My hypothesis was not supported by this experiment. This shows that the predicted acceleration was inaccurate. But the force was proven to affect the acceleration, because as the time got faster, the acceleration grew.